Additional Tutorials
Clustering
Here we will observe how to cluster our data both based on spatial relationships and attribute values (and then both together).
from sklearn.cluster import KMeans  # for clustering
import geopandas as gpd  # for data manipulation
pluto = gpd.read_file("../Data/nyc_mappluto_24v1_1_shp/MapPLUTO.shp")Cluster based on attribute data
# get clusters using kmeans

kmeans = KMeans(n_clusters=5)
kmeans.fit(pluto[["NumFloors", "ResArea"]])

pluto["NumFloorsCluster"] = kmeans.predict(pluto[["NumFloors", "ResArea"]])pluto.groupby("NumFloorsCluster").NumFloors.describe().sort_values("max")
vertical-align: top;
}
.dataframe thead th {
text-align: right;
}
| count | mean | std | min | 25% | 50% | 75% | max | |
|---|---|---|---|---|---|---|---|---|
| NumFloorsCluster | ||||||||
| 2 | 5.0 | 18.600000 | 8.264381 | 13.0 | 14.0 | 15.0 | 18.0 | 33.0 |
| 4 | 1.0 | 33.000000 | NaN | 33.0 | 33.0 | 33.0 | 33.0 | 33.0 |
| 3 | 5580.0 | 12.516174 | 9.462652 | 0.0 | 6.0 | 9.0 | 16.0 | 82.0 |
| 1 | 469.0 | 24.384861 | 16.606995 | 0.0 | 13.0 | 20.0 | 33.0 | 98.0 |
| 0 | 850764.0 | 2.278651 | 1.545119 | 0.0 | 2.0 | 2.0 | 2.5 | 104.0 |
pluto.plot.scatter(x="NumFloors", y="ResArea", c="NumFloorsCluster", cmap="tab10")<Axes: xlabel='NumFloors', ylabel='ResArea'>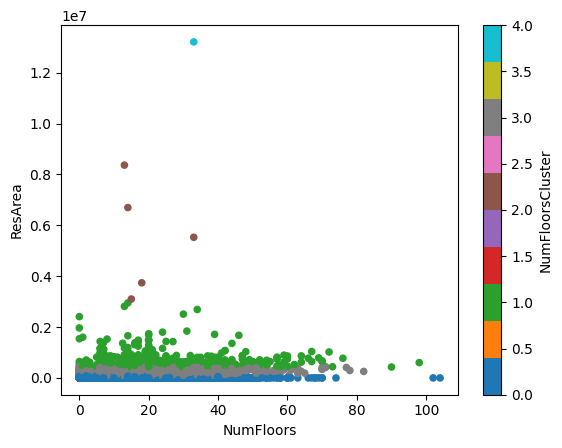
# same as above but with log y axis instead of linear to be able to see the clusters better
pluto.plot.scatter(
    x="NumFloors", y="ResArea", c="NumFloorsCluster", cmap="tab10", logy=True
)
<Axes: xlabel='NumFloors', ylabel='ResArea'>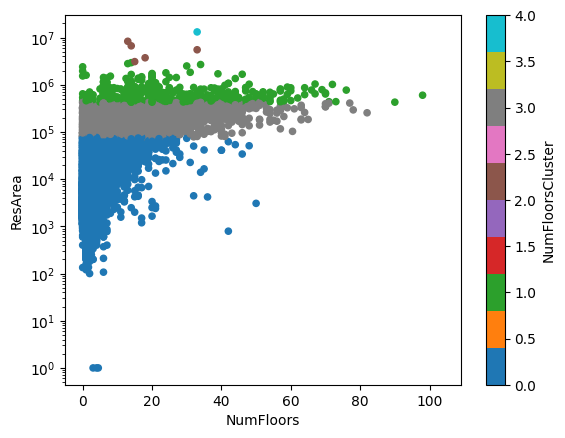
pluto["NumFloorsCluster"].plot.hist(bins=5, alpha=0.5)<Axes: ylabel='Frequency'>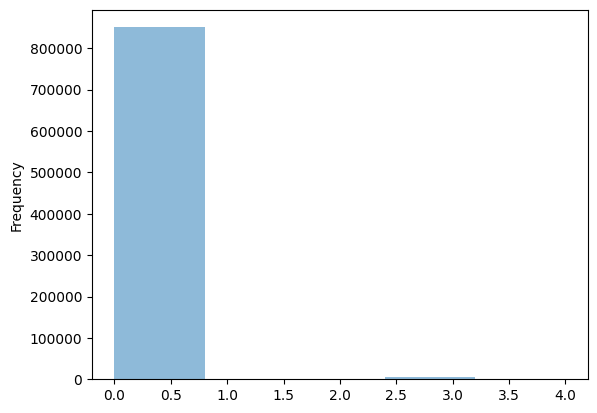
Question:
🧐 What does the shape of the clusters tell us about the data (and the relationship between buildings in NYC, residential area, and number of floors)?